

Colorado State University produces one of the industry’s best-known and the longest-running forecasts for the North Atlantic hurricane season. Now, its forecasting team is working on making their forecast even more granular, enhancing its ability to predict storms that can drive insurance losses into the billions of dollars if they make landfall in highly exposed areas.
CSU released its initial 2025 forecast last month, predicting another above-average season with nine hurricanes and 17 named storms1. Gallagher Re’s Chief Science Officer, Steve Bowen, sat down with lead researcher Dr Phil Klotzbach to talk about the detail of CSU’s 2025 forecast, longer-term trends in hurricane formation, and some of the reasons why – perhaps surprisingly – the overall number of hurricanes, typhoons and cyclones worldwide is falling, not rising, despite climate change.
Steve Bowen: First things first, can you give us a brief recap of the CSU 2025 hurricane season forecast?
Phil Klotzbach: Of course. We’re forecasting an above-normal hurricane season in 2025, with a total of 17 named storms (e.g., storms named by the National Hurricane Center). Of those 17, we predict nine will become hurricanes and of those nine, four will become major Category 3, 4, or 5 hurricanes on the Saffir-Simpson Hurricane Wind scale. We focus on major hurricanes (categorized as winds of 111mph or greater) because, even though they only make up about 20-25% of storms in an average season, they account for 80-85% of damage.
This forecast is slightly above the long-term average of 14 storms, seven hurricanes and three major hurricanes. But it is below what we saw in 2024, when we had 18 named storms, 11 hurricanes and five major hurricanes.
We also predict above-average levels of Accumulated Cyclone Energy, or ACE, across the entire Atlantic Basin (the North Atlantic, the Caribbean and the Gulf). This integrated metric accounts for storm intensity and duration, so long-lived, major hurricanes like Beryl last year generate huge amounts of ACE, whereas short-lived weak storms generate low levels. The 1991-2020 ACE average value stands at 123, and for 2025, we’re predicting 155 (compared to 162 ACE in 2024).
ACE is a key metric to measure because it gets closer to understanding the potential impacts of storms. In 2023, we started forecasting ACE for the western half of the Atlantic basin (60th Meridian West, a line of longitude that forms the approximate eastern boundary of the Caribbean). This area of the basin is significant because it’s where population and property density are highest. Our future aim is to forecast North Atlantic landfall ACE, which will be the wind energy spent over land, anywhere in the basin, to help better assess impactful storm activity.
SB: Based on the 2025 forecast, what can you say about likely financial or insurance impact?
PK: Unfortunately, there’s not a lot we can say this far out. Say we forecast nine hurricanes; we can't tell you exactly how many of those nine will make landfall, and even if we could, we couldn’t tell you where. And that ties in directly to the damage. If you have a nasty hurricane in a low-populated area, that damage will be very small. However, even a weaker hurricane in a densely populated metropolitan area can cause a lot of damage.
That said, a busier season generally means more opportunities for storms to make landfall. Last year was a good example, with 11 hurricanes and five US hurricane landfalls, two of which (Helene and Milton) caused significant damage. For reference, the record for US landfalling hurricanes in a season is six – most recently achieved in 2020.
SB: We know that the 2024 season was slightly unusual. How well did your forecast perform in 2024?
PK: When we created our April 2024 forecast, we said it would likely be extremely busy, forecasting 11 hurricanes and five of these 11 becoming major hurricanes. Those numbers turned out to be exactly right.
We were very confident in the April prediction because at that point, we had record warm temperatures in the tropical Atlantic, where hurricanes form, and we were also coming out of a strong El Niño event, transitioning over to La Niña. El Niño is warmer-than-normal water in the eastern and central tropical Pacific, and the opposite, La Niña, is colder-than-normal water in that same region. Together, this cycle, and the associated atmosphere response, is known as ENSO, or El Niño-Southern Oscillation.
ENSO matters for Atlantic hurricanes because it alters levels of vertical wind shear. High levels of vertical wind shear can tear apart hurricanes, which is what we typically get in an El Niño phase, whereas La Niña has much lower levels of vertical wind shear and tends to lead to busier hurricane seasons.
So, in 2024, we anticipated very low shear and very warm waters (providing ample fuel for hurricanes during the peak of the season), and that’s what we got, although the peak season lull was unusual.
SB: So, how do those factors – the ENSO cycle and the wind shear – factor into your 2025 prediction?
PK: Fortunately, conditions don't look as conducive as last year. Last month, NOAA declared that La Niña has ended2 and that we're most likely to have neutral conditions, meaning neither El Niño nor La Niña, for the peak of the season, which we usually define as August through October.
Meanwhile, the tropical Atlantic has cooled relative to normal, albeit still a bit warmer than usual. Overall, we think conditions look like we are in for an above-average season, but signals for an active season are not nearly as robust as they were last year.
SB: CSU was the first institution to produce an annual North Atlantic hurricane season forecast way back in 1984. How have your predictions performed over a more extended period? How useful are they to insurers in their decision-making?
PK: When we look at how many hurricanes we predicted each year versus how many we observed, we see a pretty strong correlation and one that improves as we progress through the season.
Since 2014, the April forecast has had a 0.59 correlation with observed results, which rises to 0.69 in June and 0.84 in August. In statistical terms, that’s a moderate positive correlation rising to a strong one.
Figure 1: CSU long-term seasonal hurricane forecast track record as measured by correlations between predicted and observed hurricane activity.
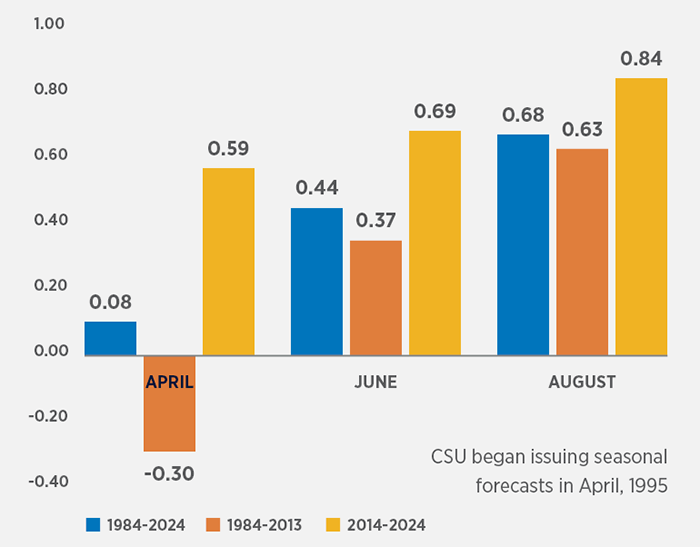
Source: Colorado State University
There’s been a noticeable improvement in forecast accuracy in the past 10 years, most likely due to better data. Improved historical datasets give us a better understanding of the past, and improved climate models provide useful information on ENSO conditions, Atlantic water temperatures, and wind shear patterns ahead of time.
Regarding insurance decision-making for any particular year, forecasts are probably not a great tool for pricing, for example. But when you start looking at the correlations between our forecasts and the damage incurred over five-to-ten-year time horizons, you begin to see significant results. If you look at the years where we forecast ‘busy’ versus the years we forecast ‘quiet’, there’s a noticeable difference in the distribution of landfalls and damage.
SB: How important are your shorter-term forecasts, particularly as the season progresses and we know more?
PK: I often get asked, “What can people do with the [April] seasonal forecast?” My answer is that it’s an informational tool. Using 2020 as an example, we had 30 storms, yet only one tropical storm landfall in Florida. If you told me there would be all this activity in the Gulf, I would assume that Florida would be hit all the time, and yet they managed to avoid most of the effects while Louisiana was getting hit almost every other week.
With the two-week forecasts that we release, beginning in August, you’re starting to get useful information about which regions we should be monitoring and looking more at preparedness and wider decision-making.
One of the best examples was 2023. We put out a forecast in about mid-August that said, 'OK, 2023 up to this point has been kind of average, but it looks to be getting busy, and there's something we need to be watching coming out of the Western Caribbean or southern Gulf.’ And that was Hurricane Idalia, the biggest storm of the season in terms of impact.
So, I think when you get to that two-week time frame, you're not going to be perfect, but you can start to highlight areas or regions of concern.
SB: What can we expect future hurricane seasons to look like?
PK: We've looked a lot at trends in tropical cyclone activity around the globe. These storms, when they reach winds of at least 74mph, are called hurricanes in the Atlantic and eastern North Pacific, typhoons in the western North Pacific, and cyclones in the North Indian Ocean and Southern Hemisphere.
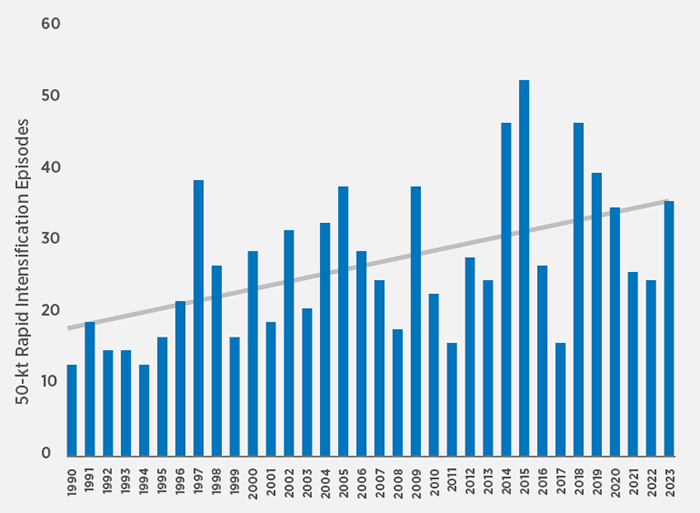
If we look globally at all hurricane-strength storms since 1990, the average annual number of Tropical Cyclones has actually gone down.
Figure 2: Count of global hurricanes/typhoons/cyclones from 1990 to 2024 showing a decrease in the number of storms annually.

Source: Colorado State University
That's because globally, we've been trending more towards La Niña conditions. And while La Niña is good for Atlantic hurricanes, it’s bad for Pacific storms. The Pacific is a larger ocean with more heat content, which will tend to drive down the overall global number of storms when conditions are suppressed.
That takes a lot of people by surprise and raises a lot of questions. Is this decrease going to continue? Is this trend towards La Niña permanent? What role does climate change play?
Additionally, climate models pretty much all say we should have more El Niño phases in the future, but real-world observations seem to be telling us we're headed towards La Niña. A more El Niño-like future is very different for hurricanes, but also wildfires, droughts, and floods. All this stuff is critically dependent on ENSO, so we need to figure out this inconsistency to better understand future risk.
SB: Do we see any longer-term trends in losses from hurricane activity?
PK: I would say that, overall, storms are costing more. However, we know that one reason for this is because there are a lot more people and things in harm's way.
Gallagher Re has done a lot of work on this, and this work suggests that these factors are a key driver in why storms are costing more. If you normalize the losses—taking historical storms and adjusting them based on population, inflation and wealth—the trend is basically flat.
However, these normalizations have all assumed that the building portfolio was constant, which we know is not true. We know that building codes have improved over time, particularly after major events, for example, in Florida after Hurricane Andrew in 1992. So, if the same event happened again, the structures would stand up a lot better, which needs to be accounted for when considering loss trends.
SB: Finally, can you tell us about your research alongside Gallagher Re?
PK: Sure. Another trend we’ve observed is that storms are intensifying more rapidly. We’re doing a lot of work with Gallagher Re on this because we’ve seen a lot of it in recent years, especially in the North Atlantic.
Take Hurricane Otis in 2023 – in 26 hours it went from a weak tropical storm to a Cat-5 hurricane making landfall in Mexico. In 2024, nine out of 18 North Atlantic storms underwent rapid intensification (RI). That’s tied with 1995 and 2010 for the most RI storms in a single Atlantic season on record.
The definition we've used for what we call ‘rapid intensification’ is when winds increase by 35mph or more in a 24-hour period. Now, the numbers of RI storms of this kind don’t show much of an upward trend overall. But if we look at a higher intensity threshold of winds increasing by at least 60mph in one day – ‘explosive’ RI – that has increased since around 1990.
Figure 3: Count of global tropical cyclones undergoing ‘explosive’ RI since 1990
Source: NOAA and Joint Typhoon Warning Center; graphic and analysis: Colorado State University and Gallagher Re.
That’s likely because oceans are warmer. While you need a lot more than just a warm ocean to get rapid intensification, if it's super warm, it loads the dice towards these high-end rapid intensification events.
As a result, the research we’re doing as part of Gallagher Re’s Global Tropical Cyclone Research Consortium will examine how rapid intensification varies under different climate states and different phases of the ENSO cycle, as well as for different parts of the world.
The research will help Gallagher Re assess whether existing Tropical Cyclone risk models account for RI trends and develop alternative risk perspectives for their clients.
SB: Thank you, Phil, for taking us through what we can expect from the 2025 hurricane season and beyond.
You can learn more about this in CSU’s April forecast1, and watch out for CSU's future updates in June and August.
2025 Atlantic Hurricane Season Outlook and Analysis of other North American Natural Catastrophes
Join Gallagher Re natural catastrophe specialists and our Gallagher Research Centre partners at Colorado State University for an insightful webinar that explores CSU forecasts, hurricane activity, and potential market impacts of major North American property cat perils.
Date: June 12th, 2025
Time: 4:00 PM CET; 3:00 PM BST; 10:00 AM EDT
Register now to hear the latest insights as we head into the 2025 hurricane season.