The 2025 US Benefits Benchmarks report offers comprehensive, data-driven insights into medical, pharmacy and voluntary benefits, as well as absence management strategies.

This report uses data from Gallagher's nationwide Benefits Strategy & Benchmarking Survey to help organizations plan for future success:

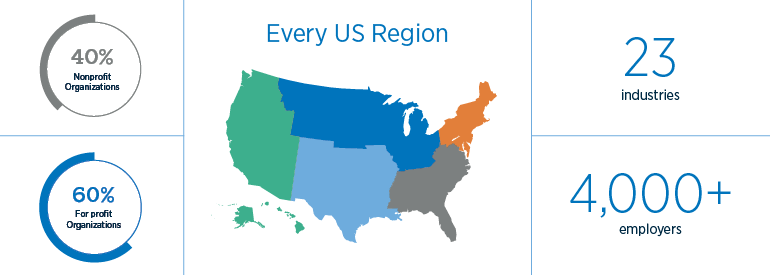
  • It's based on survey data gathered from 4,000+ organizations between January and March 2025.
  • It covers crucial topics such as managing rising healthcare and prescription drug costs, customizing voluntary benefits to meet diverse workforce needs, and implementing effective absence management and family-friendly policies.
  • Use this report to optimize your people strategies, maximize investments, mitigate risks and make strategic decisions to support the health and wellbeing of your employees and their families.

5 trends to watch in employee benefits

CDHPs Losing Popularity

55% offer a CDHP with an HSA, down 1 point from 2024, after a 16-point increase from 2020-2024.

PBM Contracts Under Scrutiny

21% conduct pharmacy contract reviews and negotiations to manage the use and costs of specialty drugs.

Voluntary Benefits Set to Grow

Nearly 1 in 3 expect to expand voluntary benefit offerings by 2027.

Career Development a Top Priority

Career development initiatives: 65% offer employee development training and 38% offer mentoring programs.

Family-Friendly Policies Support Parents

Nearly 1 in 5 offer parental leave prior to pregnancy disability beyond what is required by law.

Get The Report

Making tough benefits and HR decisions? This report can help.

When it comes to attracting and retaining talent without compromising the bottom line, business leaders are saddled with difficult choices, including:

  • Meeting or mitigating salary demands
  • Balancing retention efforts and revenue goals
  • Designing comprehensive benefits strategies for all generations in the workforce to ensure all employees feel supported
  • Managing the use and cost of specialty drugs

In this report: See how 4,000+ organizations are navigating these decisions so their people and businesses can thrive.

Employers like you helped fuel this report

Data was collected from:

Every US region; 60% for-profits; 40% nonprofits; 23 industries; more than 4,000 employers