
Author: Alex Burton, Dan Gilhooly
As we reach the midpoint of 2021, the market remains very challenging and is pretty similar to 2020. While there is optimism toward some moderation in premium increases, it has yet to be widely seen in year-to-date 2021 renewals. Across the industry, renewals for many companies have been upwards of 20%, which was unsettling after an already difficult year. What has made this market even more troubling is that there is no single event to point to as the cause. Instead, a confluence of factors have challenged the industry, including social inflation, increased storm activity and pandemic losses. Additionally, carriers' ability to offset these results through investment income remains a challenge due to the lower interest rate environment.
Unfortunately, these factors likely will impact the market for some time. Despite pushing significant rate increases across most lines in 2020, the industry's combined ratio hovered around 100%. Accordingly, all market indicators point to a continuation of premium increases for the balance of the year and possibly into 2022.
However, there is optimism for some moderation in certain lines as we move into the latter half of 2021. Many carriers have reported stronger results in the first quarter of this year, but that progress must be sustained for several quarters to see a market shift. The challenges have not kept out new capital and the market is seeing some expansion, which will inevitably lead to more competition. Finally, despite across-the-board increases on January 1 reinsurance renewals, the rate increases ultimately ended up at the lower end of initial projections.
In this report, we will analyze the market conditions for each major line of coverage and offer guidance to help you ensure a successful renewal outcome.
General and Professional Liability
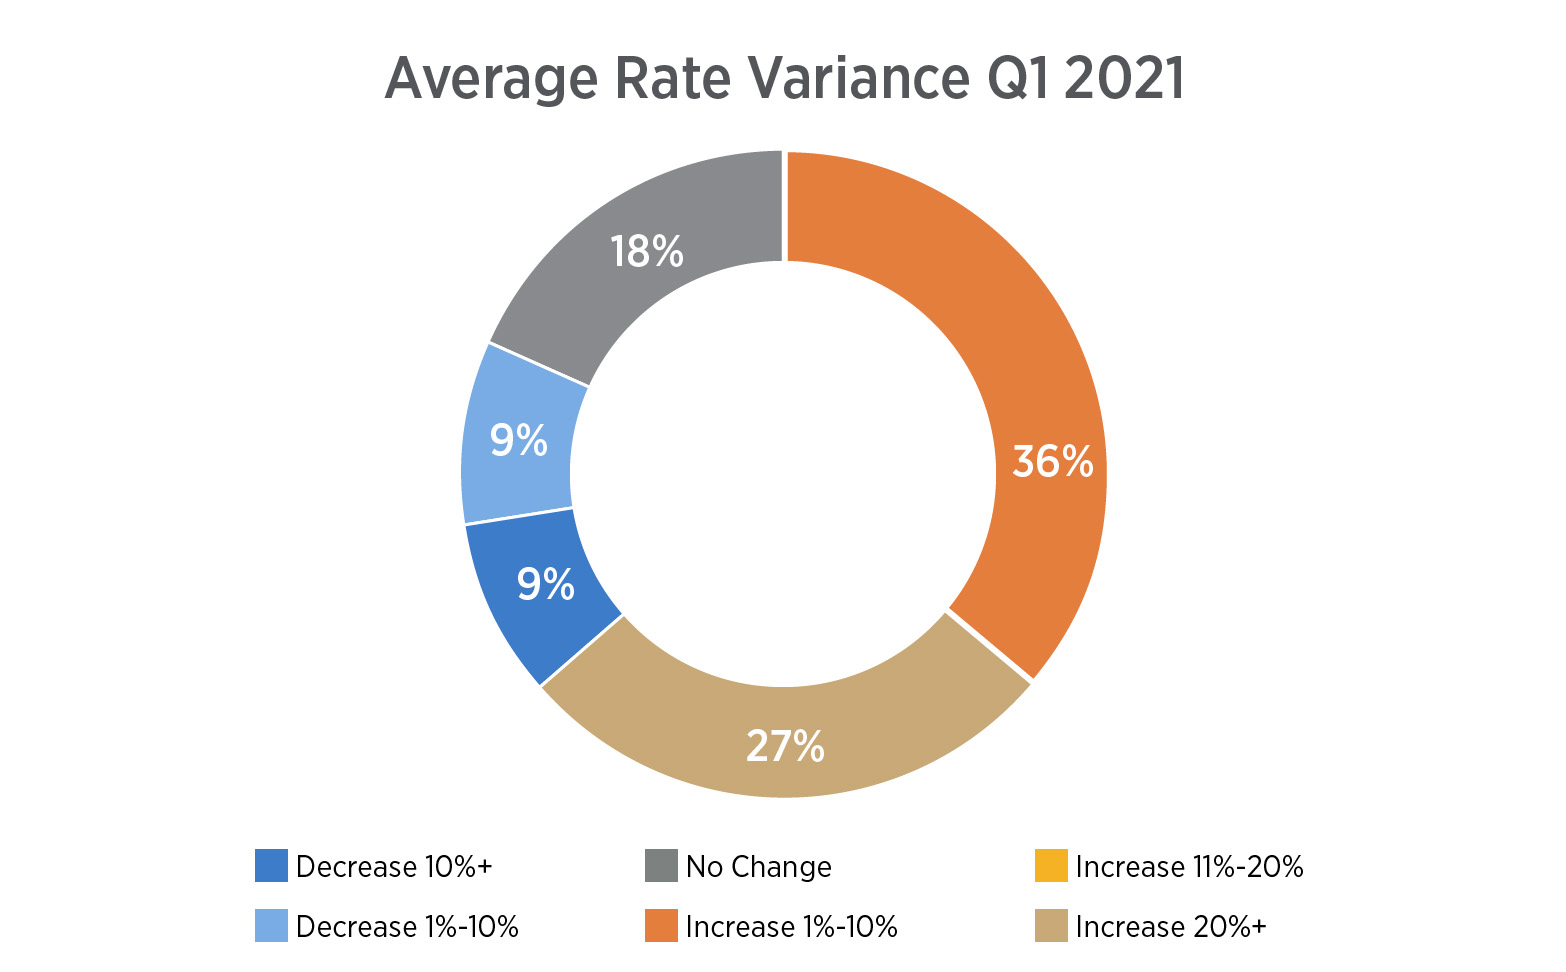
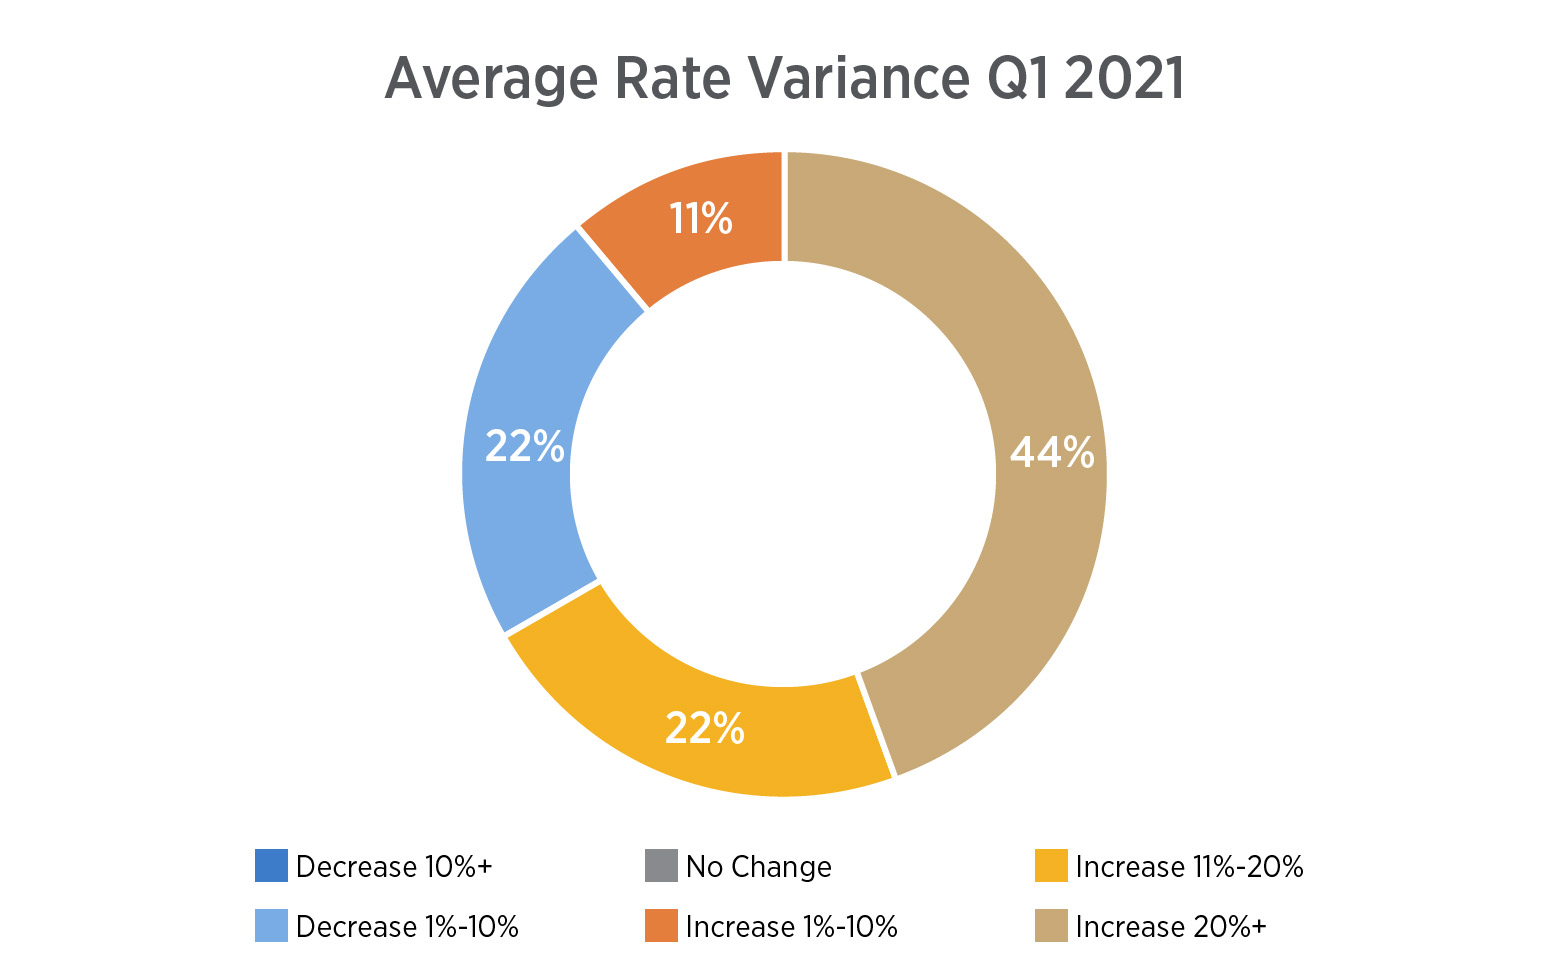
The first quarter of 2021 remained challenging for most senior living organizations renewing during this time because the rate impact of COVID-19 hadn't hit these renewals yet with its emergence in late March of 2020. However, as we moved into April and May, rates continue to be challenging, but not near the levels of what we have seen over the last 12 months. As the vaccination rates of senior living residents and staff continue to increase, causing case counts to decline, the outlook is considerably improved. These results, along with the majority of carriers issuing exclusions for COVID-19, have created a more stable environment from a rate perspective.
Prior to COVID-19, we had been in a soft market for about 15 years, with year-over-year (YOY) average renewals achieving flat to decreased rates during the majority of that time. As loss cost trends have continued to rise annually plus the significant amount of unknown incurred but not reported (IBNR) losses, carriers are still in need of rate increases in most cases. However, the increases are becoming more moderate compared to what was seen in 2020, as carriers were able to achieve more appropriate rates last year. Also, there has been an emergence of capacity as new carriers and Risk Retention Group (RRGs) have begun entering the space.
Key carrier considerations:
- Underwriters are looking at every account on a case-by-case basis, and using conservative actuarial modeling and predictive analytics to develop their pricing/structures.
- Carriers are evaluating their quality/compliance policies and procedures much more closely, along with their infection control plans and formal clinical risk management programs.
- There is a continued push to move coverage forms from occurrence to claims made. This change in form will result in further increase considerations YOY, as organizations will see step factor increases for three to five years from the retroactive date. Note: Step factors are the annual expected increases to reflect the increase in exposure as more time passes from the retroactive date.
- Most carriers will no longer offer first-dollar programs and are starting with deductibles of $25,000 or $50,000 and, in many cases, a deductible/SIR of $100,000 or higher.
Lastly, we are continuing to see higher utilization alternative risk solutions through captives. These solutions require a very strategic approach to risk management, and can be extremely effective in reducing volatility and combating the hard market.
The following chart outlines the average rate variance we saw in the first quarter of 2021.
Umbrella/Excess Liability
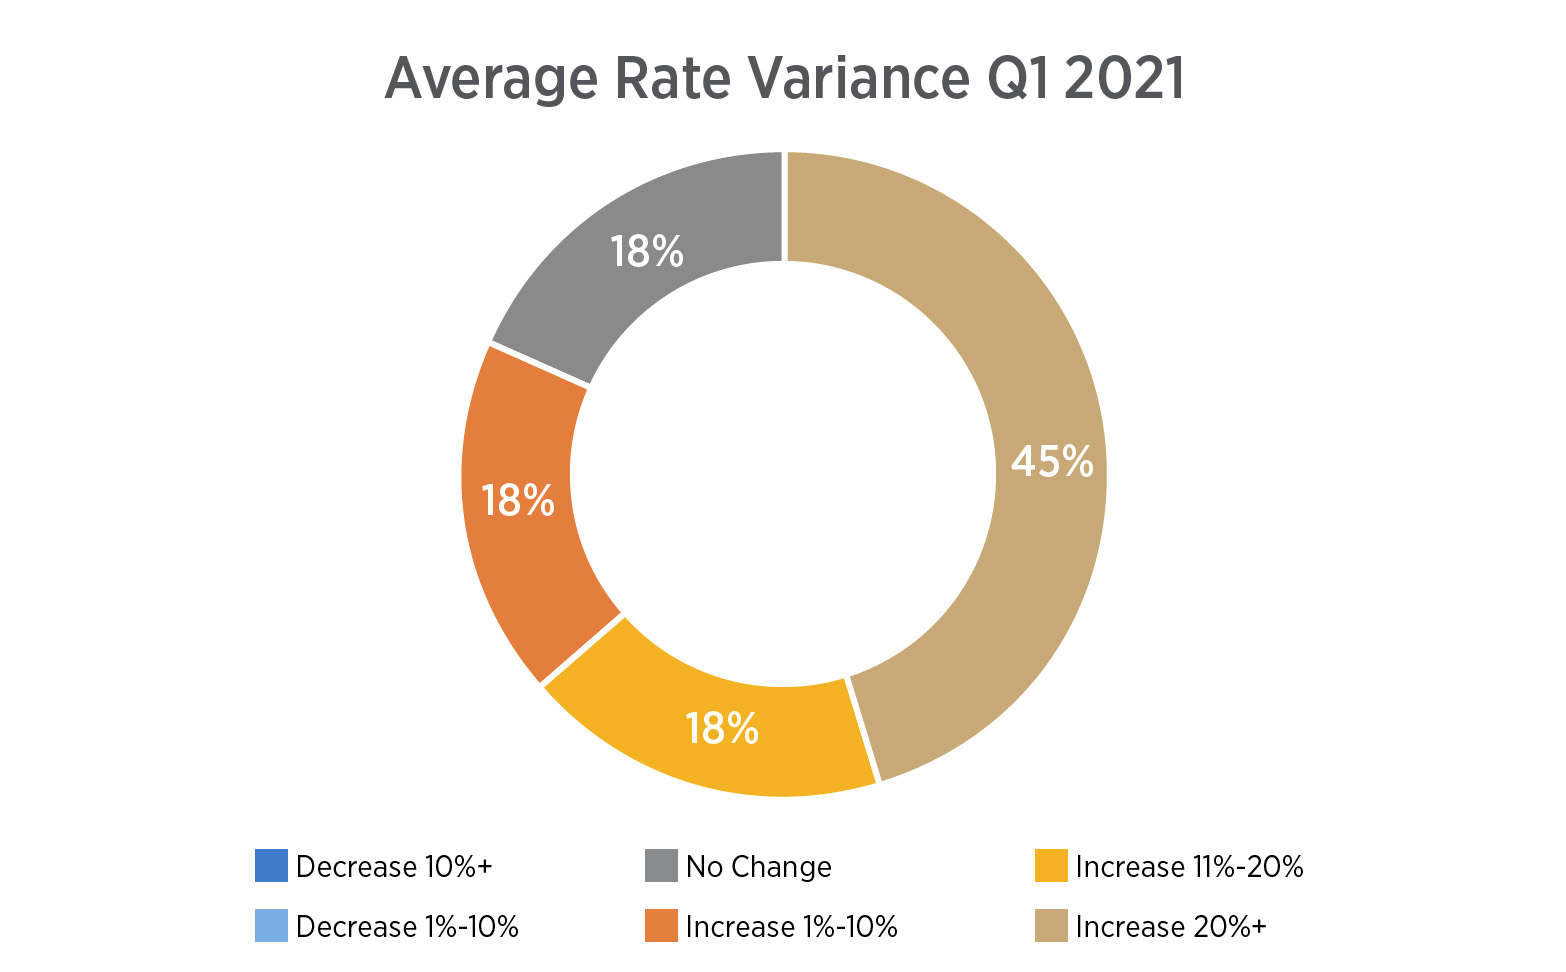
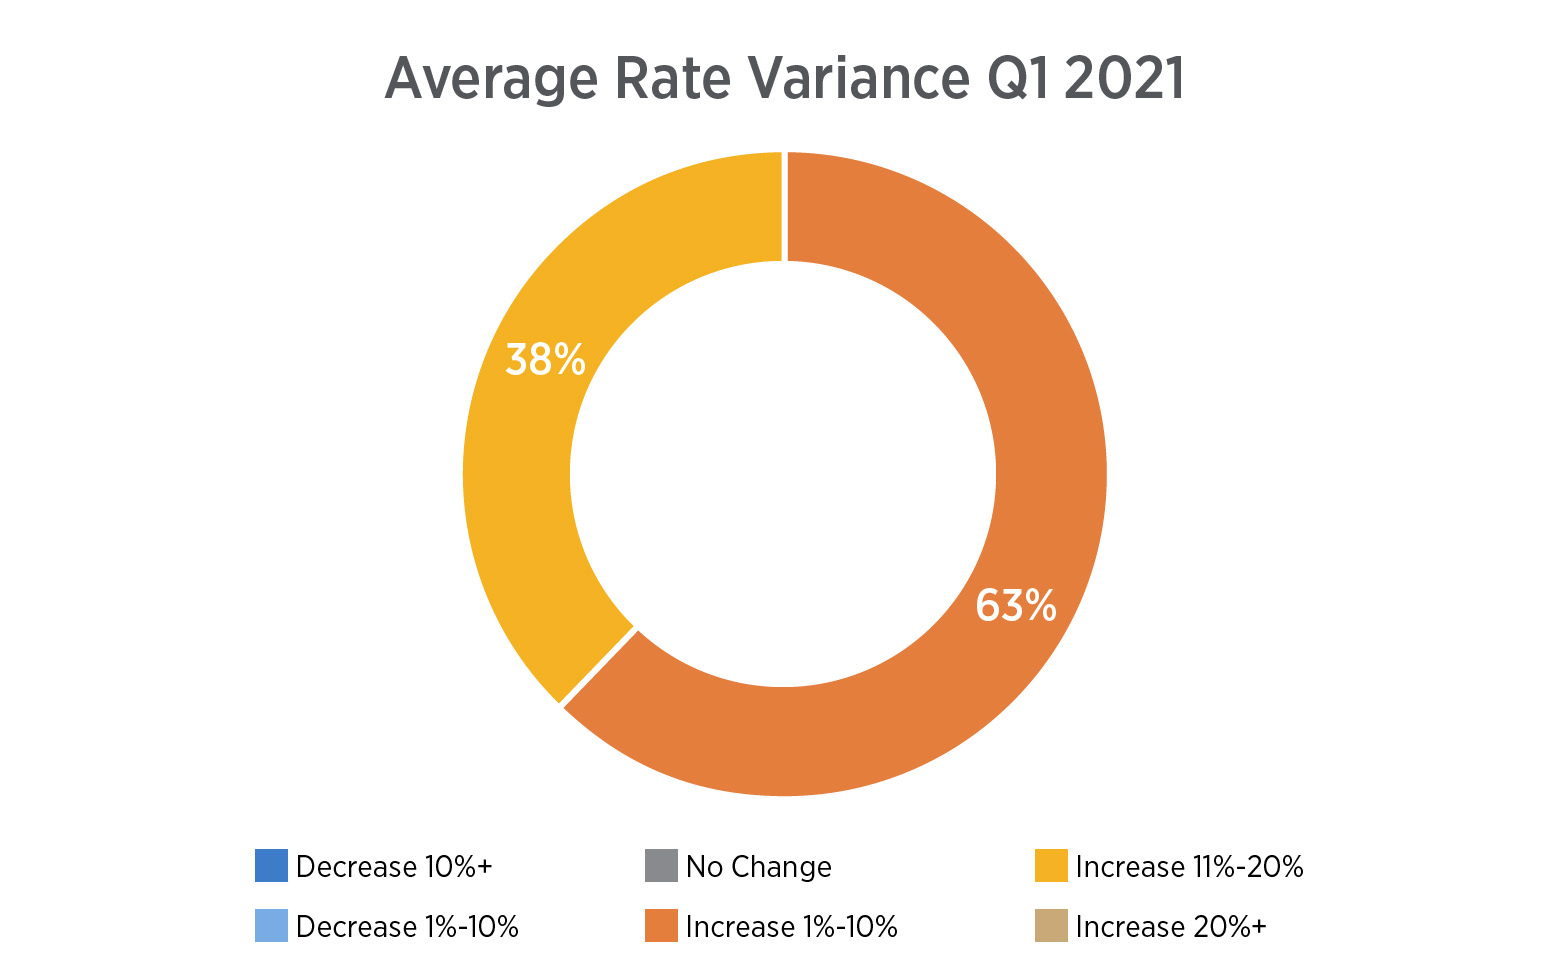
The umbrella/excess liability market has continued to remain difficult, resulting in increases that outpace the rate changes on the underlying primary. Capacity remains an issue with most carriers offering maximum limits of $5 million per layer. Also, many carriers will not provide lead umbrella/excess liability terms over some carriers' primary coverage layers, making it extremely difficult to build excess towers greater than $10 million.
The following chart outlines the average rate variance we saw in the first quarter of 2021.
Workers' Compensation
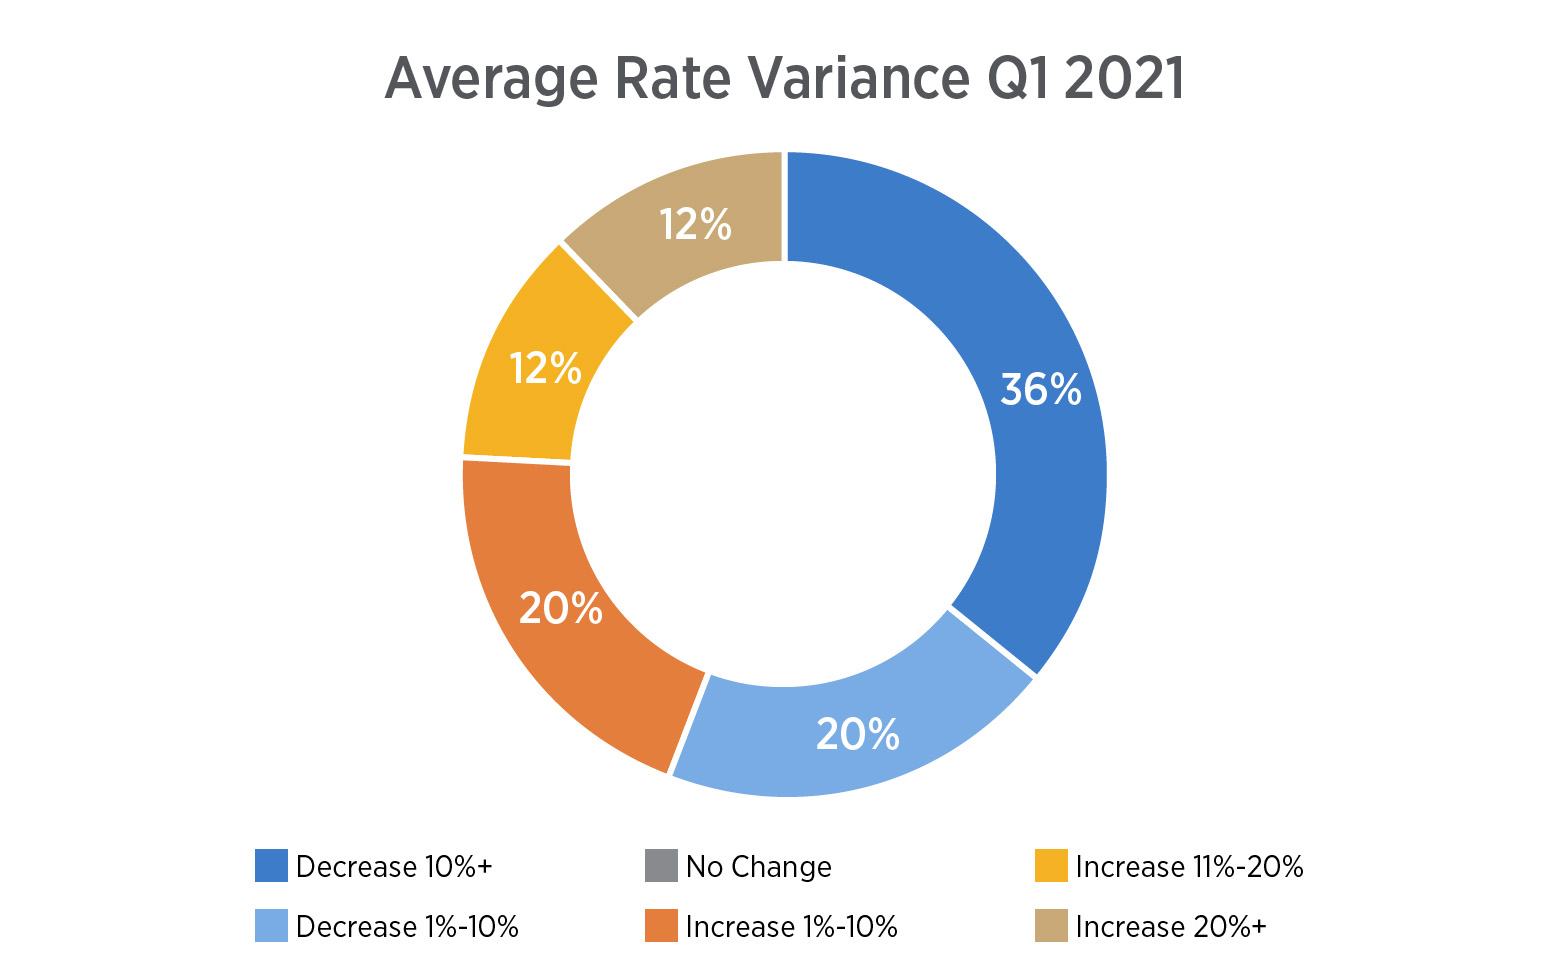
After a very challenging 2020, the workers' compensation marketplace has stabilized considerably for senior living operators. Rates skyrocketed last year in the second and third quarters due to presumption laws and the uncertainty around how work-related claims would impact the senior living industry because of front-line workers' potential exposure to COVID-19. This led to moratoriums and increases across the board over that time period. Fortunately, many of these moratoriums have now been lifted, and many carriers have regained comfort similar to the pre-pandemic days.
The following chart outlines the average rate variance we saw in the first quarter of 2021.
Property
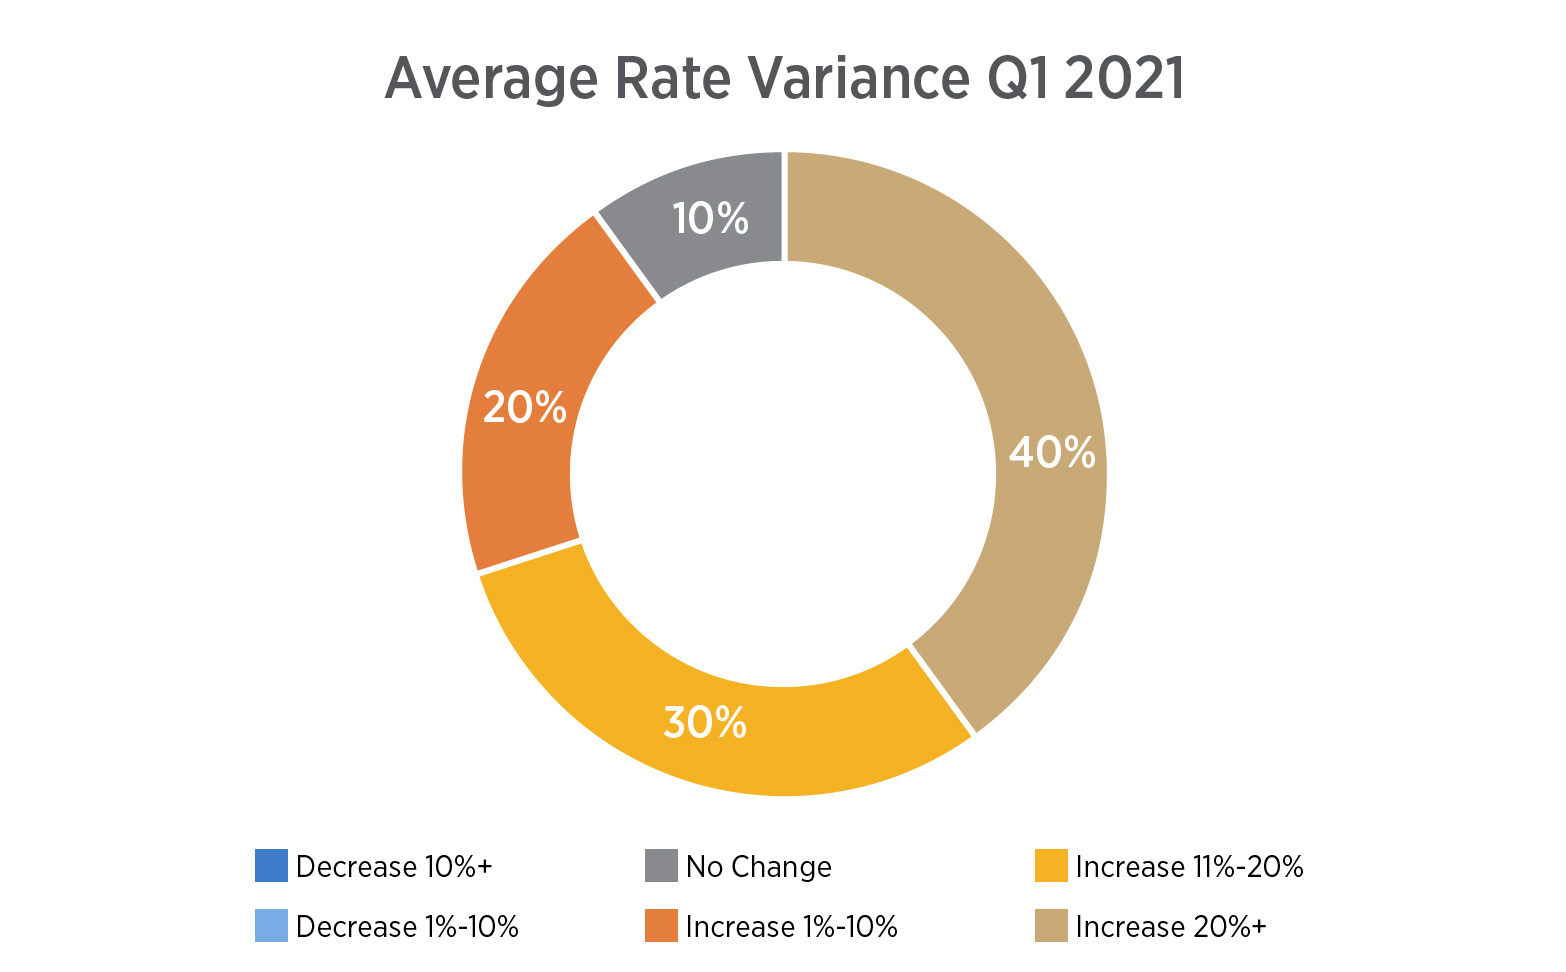
The property market has quickly become equally as challenging, if not more challenging, than the GL/PL market was in 2020. This is due to the industry having predominantly a frame construction building profile and an occupancy that creates several concerns for resident-inflicted loss (e.g., stovetop fires, water damage). Many property carriers have struggled to remain profitable on this class of business and have significantly pulled back their appetites.
Key property rate change drivers:
- Property rates will continue to rise as the frequency of natural disasters continues to rise, including the wildfires on the West Coast; coastal hurricanes; earthquakes; water damage; convective storms across the Southeast, Midwest and Midsouth; and the recent winter storm surge across the country resulting in power outages, spoilage and pipe burst/water damage claims.
- Rising loss trends and inadequate pricing has continued in the national account property space (total insurable values greater than $125 million), resulting in a lack of profitability for a number of carriers.
- Changes in coverage terms and conditions in the property marketplace have been significant. Increasing deductibles, shrinking sublimits—especially in catastrophic exposed geographies (CAT)—and carriers’ conservative limit deployment can lead to less favorable terms and conditions for clients.
- Historically, it was not uncommon to see property rates as low as $0.05–$0.075/$100 of values on senior living portfolios consisting of a blend of frame/noncombustible construction types.
- For stand-alone property placements, the starting point for frame construction has increased to closer to $0.20/$100, and underwriters are pushing for higher deductibles for all other perils, along with percents for wind/hail and increased water damage deductibles.
The following chart outlines the average rate variance we saw in the first quarter of 2021.
Commercial Auto Liability
Despite several years of price increases in commercial auto liability, rates continued to increase in the first quarter despite a drop in claim frequency due to the COVID-19 pandemic.
Key drivers of the commercial auto liability market:
- Loss costs are rising as new technologies make vehicles more expensive to repair. We expect carriers to continue to push rate increases across the board in commercial auto liability.
- There is little to no appetite for monoline auto due to the resident/patient transport exposure presenting at senior living communities. This has created a need to take a portfolio approach to placing commercial auto liability coverage with another line of business.
The following chart outlines the average rate variance we saw in the first quarter of 2021.
Management Liability
The Directors & Officers (D&O) marketplace has been distressed for several quarters, as average claims have increased substantially in recent years. The market's deterioration has continued with every aspect of the public company D&O marketplace being impacted, including premium, retention, capacity, attachment, and terms and conditions. The market for privately held companies is not nearly as hard as the publicly traded D&O market, although larger private companies may still see double-digit increases. Employment practices liability and fiduciary liability continue to firm as well, and there has been a large uptick in claims related to both of these lines of coverage in this industry.
The following chart outlines the average rate variance we saw in the first quarter of 2021.
Conclusion
A recent carrier partner used the phrase the "big five" to describe this marketplace; that is, the big five lines of insurance that are causing the most pain are auto, property, umbrella/excess, D&O and cyber. These five lines of insurance will continue to challenge brokers and clients alike throughout the rest of 2021. But we are beginning to see improved underwriting results and additional capital entering the marketplace, which could lead to some potential moderation in the second half of 2021. We will not be returning to a flat marketplace anytime soon, but hopefully, we have reached or are near the peak for at least four of the big five: auto, property, umbrella/excess and D&O. Unfortunately, we believe cyber is still in the early stages of a market correction.
Because of the highly nuanced nature of this market, it is imperative that you work with an insurance broker who specializes in your particular industry or line of coverage. Gallagher has a vast network of specialists that understand your industry and business, along with the best solutions in the marketplace for your specific challenges.

