
Author: Glenn Drees, CSP, CPCU

Labor shortages, rising input costs for agricultural businesses, rising ingredient costs for food manufacturers, rising wholesale prices for grocery stores, COVID-19 variants and increased transportation costs are all challenges for our clients right now. We are working diligently to make sure that we help you manage business risks and renew your insurance protection both effectively and efficiently.
Property
Property insurance continues to be a challenge for the food and agriculture insurers and, as such, the industry is seeing higher rate increases than the general market. We are seeing some reduction in the percent of rate increase for the 75th percentile and higher placements.
The story has not changed as to what accounts will receive the most underwriting scrutiny — occupancies with inadequate or poor fire protection, buildings exposed to catastrophic losses such as wildfires and hurricanes, highly concentrated values in a single building or fire division, highly damageable stock, accounts with unresolved risk improvement recommendations and businesses that have had poor loss history.
- In Q3 of 2021, 77.0% of Gallagher's Food & Agriculture clients saw either flat or increased rates. This is an improvement over the prior two quarters and signals a slowing of rate increases.
- The median Gallagher property rate increase for Q3 2021 was 8.0%.
- Our competitor's median property rate increase for Q3 2021 was 10.8%.


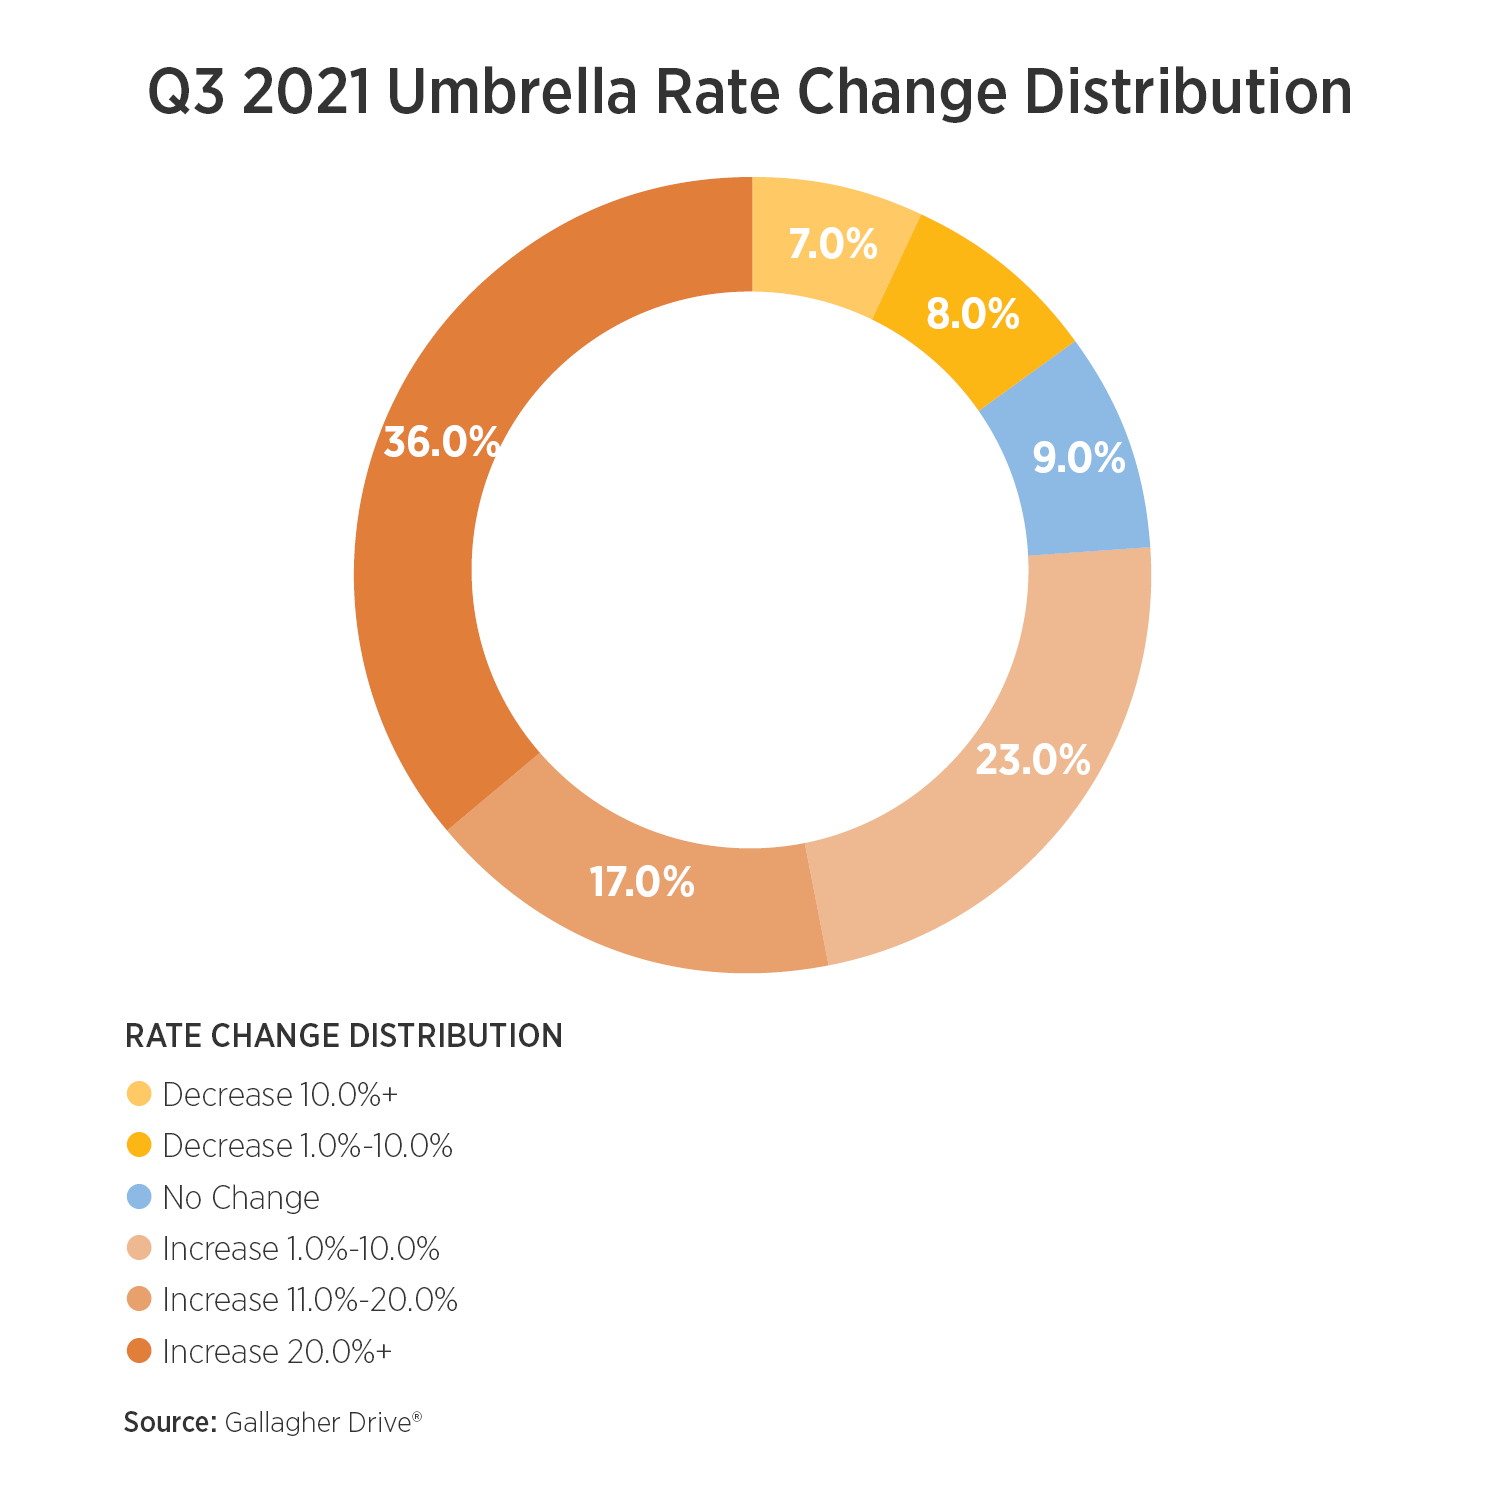
Umbrella/Excess
The themes from our prior commentary have not shifted much. Food and agriculture accounts often have large fleets, provide ingredients that go into other food and agricultural products, and accept and transfer liability through contracts. Insurer's claims history continues to tell underwriters that they need more rate although the amount of increase is beginning to show signs of leveling-off.

- 0% of our clients saw flat or increased rates.
- The median Gallagher client rate change in Q3 2021 was 11.2%, which is similar to our competitor's results.
- We continue to use our superior market access to find the most cost efficient capacity for umbrella towers.
Cyber
Food and agriculture clients are not immune to cyber attacks and the associated disruptions that they cause. Gallagher's dedicated cyber team is working with clients to benchmark adequate limits, improve data security controls, and understand business interruption implications from a successful ransomware or cyber attack.

The rate trend for cyber continues to deteriorate and will likely continue to go higher for the foreseeable future.

Product Recall
A bright spot in the food and agriculture space is product recall. The coverage offerings have been stable from both a pricing and coverage standpoint. Our formidable recall/contamination team is getting the best results attainable in the marketplace. Each placement is unique and our team of specialists works directly with insurance company underwriters to design the coverage and negotiate the premium. When there is a claim, our team works to maximize the recovery.
- The most recent quarter renewal trends are flat to low single-digit increases for most accounts.
- $25 million limits continue to be easily attained for most food and ingredient companies with higher limits available when needed.
- The strong market for experienced and creative product recall brokers is being helped by the increase in the number MGUs and MGAs.
Conclusion
Gallagher's team of dedicated Food and Agriculture brokers are getting best in class results for our clients and are being sought by others because of our market clout, expertise, data and analytics, and client centric risk management solutions. We strongly recommend that you start your renewal process early and leverage our team to help you achieve best in class results for 2022 and beyond.
Sources:
The data for all charts with this document was pulled utilizing Gallagher Drive®, our proprietary data and analytics platform. U.S. Client Data, July 2021–September 2021. The median is the value separating the higher half from the lower half data sample (or the middle value). Due to the variability that we're seeing in this market and specific account characteristics, individual rates may vary.
