Authors: Kelly Taylor Heather O’Neill

There is no shortage of headlines about the pay gap between healthcare chief executive officers (CEOs) and the "typical" employee. However, most articles on the pay gap cite data from the country's largest for-profit health insurers and pharmaceutical companies, largely excluding hospitals and health systems.
Because not-for-profit (NFP) hospitals and health systems make up about 80% of the nation's healthcare providers,1 Gallagher's healthcare compensation analysts explored to what extent the reported pay gap trends hold for the majority of NFP hospitals and health systems.
Background on CEO-to-typical-employee pay ratio
A 2015 Securities and Exchange Commission (SEC) rule requires public companies to disclose their CEO-to-typical-employee pay ratio. Thus, NFP healthcare is off the hook for now, but that doesn't exclude hospital CEOs, boards and their compensation committees from public scrutiny on the issue.
New legislation in California is making headlines and drawing attention to healthcare compensation once again. A law signed in October 2023 will raise healthcare worker wages to a minimum of $25/hour over several years.2 Before this announcement, four California cities had considered ballot initiatives to limit healthcare executive compensation using one of two approaches:
- Los Angeles aimed to limit NFP healthcare CEO pay to the salary and expense allowance of the President of the United States (currently $450,000).
- San Diego, Chula Vista and La Mesa proposed limiting CEO compensation to 15 times the minimum hourly wage in their respective municipalities (currently equating to $483,000 - $509,000).3
While these initiatives capitalized on the media coverage surrounding executive compensation, observers may wonder to what extent empirical evidence supports all the buzz. Now is the time for NFP healthcare providers to become aware of their CEO-to-typical-employee pay ratio to better prepare for both internal and external conversations.
A closer look at CEO-to-typical-worker pay: NFP numbers tell a different story
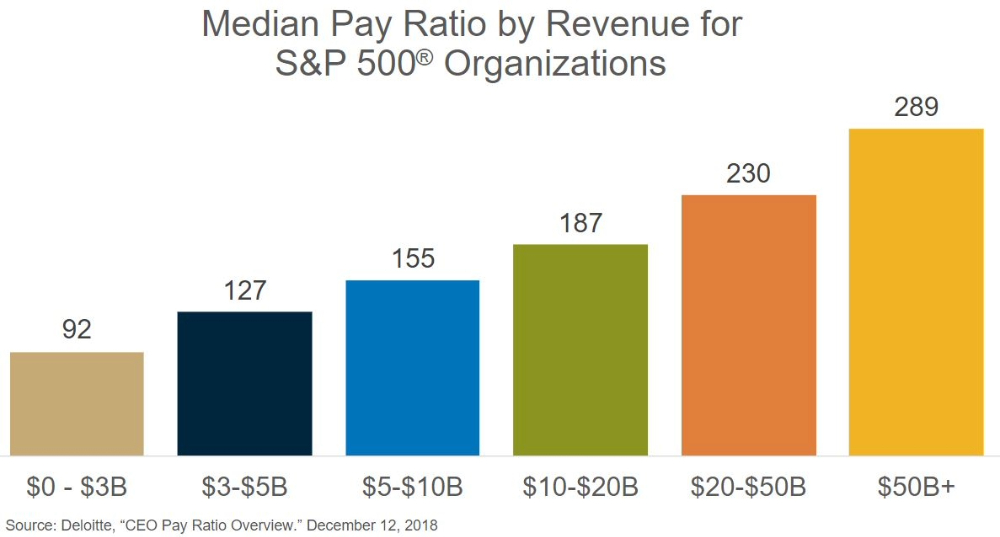
The ratio of CEO-to-typical-worker pay in the nation's largest public organizations, as captured in the S&P 500®, averages 272:1.4 Meanwhile, the average at some of the largest health insurance organizations is a staggering 296:1.5 Important data points, but how does this ratio translate to NFP hospitals and health systems that operate and pay using different models?
Gallagher conducted a matched sample analysis using our extensive proprietary database of executive, management and staff compensation practices from more than 5,200 healthcare organizations. The results reveal a much different picture for NFP healthcare systems and hospitals.
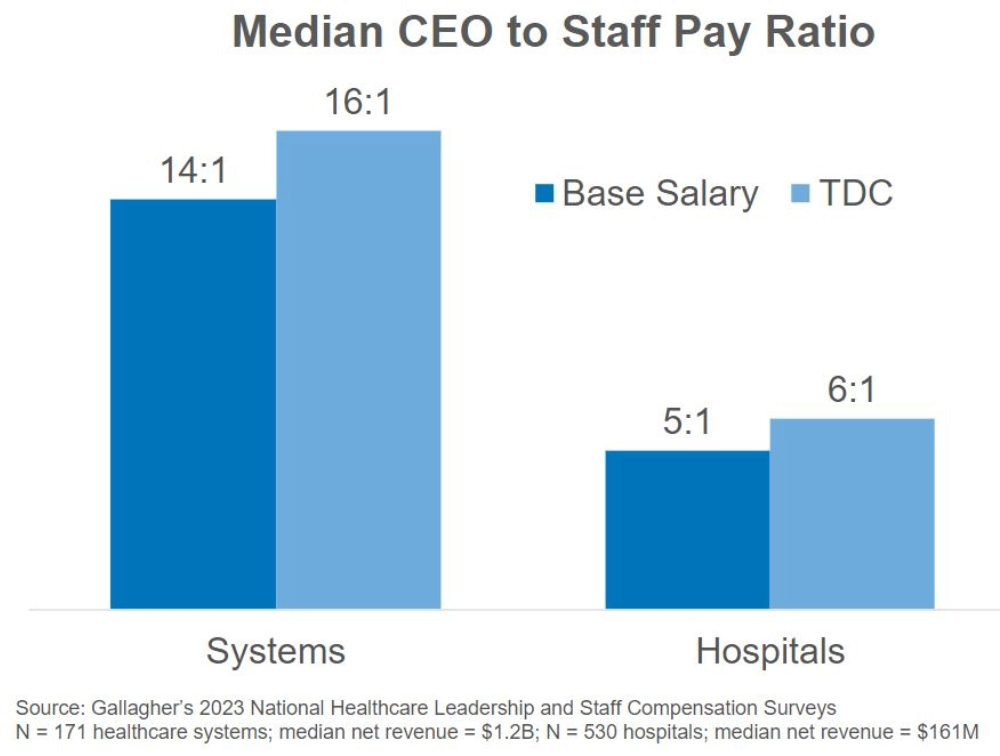
NFP healthcare system (median net revenue of $1.2B) CEOs in Gallagher's database receive base salaries that are about 14 times higher than the median hospital worker (includes staff and non-CEO leaders but excludes physicians). The pay level and job titles that may constitute the median worker vary by organization. Some examples include coder, administrative assistant, radiology technologist and surgical technologist.
The ratio in NFP hospitals (median net revenue of $161M) is even more modest, at about 5:1. Pay ratios increase slightly when comparing worker pay to CEO total direct cash (TDC) — which is salary and incentives combined — as CEOs often have more pay at risk. The ratios observed in our analysis reveal a vastly smaller gap compared to the for-profit organizations most often highlighted in the media.
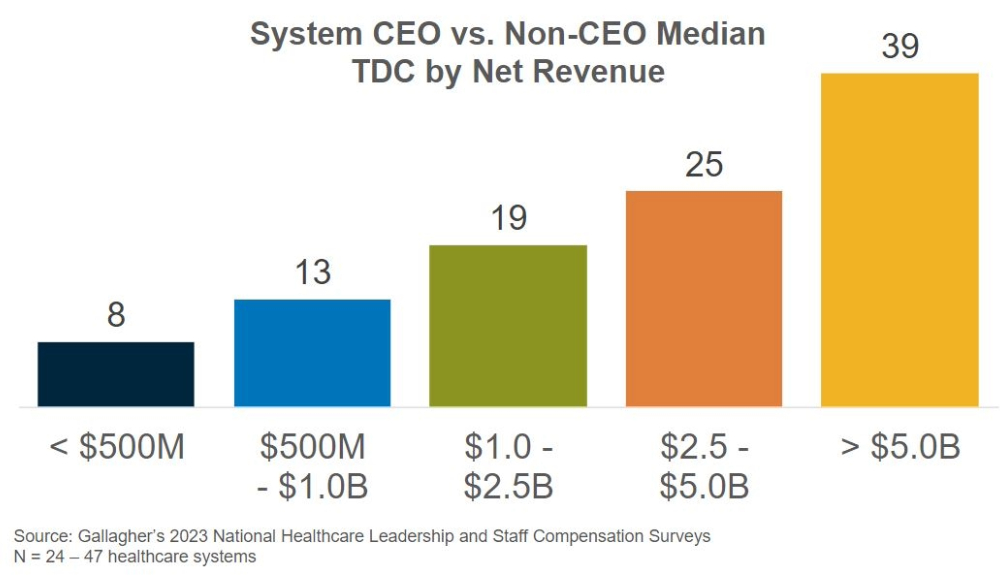
Gallagher's analysis did find ratios upwards of 39:1 in the largest health systems (>$5B net revenue), yet these levels aren't comparable to those of similarly sized for-profit organizations, which exhibit a ratio of about 127:1.1
The ratios observed in Gallagher's analysis may not appear as dramatic as other healthcare findings comprised primarily of large for-profit health insurance and pharmaceutical companies. However, savvy hospital and health system leaders will explore these relationships in their compensation programs.
Gallagher intends to further investigate the relationship between pay for the CEO and the typical worker to shed light on issues specific to the NFP healthcare sector.
Opportunity exists for further investigation
Our exploration of this topic found the field of pay ratio research significantly lacking in common definitions, standards and analysis methodologies for calculating compensation and determining the "typical" worker. Such disparity creates challenges in comparing findings and gaining a clear picture of pay equity within an organization or industry. Further, the existing research doesn't explore factors that may influence the ratio, including CEO tenure, the organization's compensation philosophy, whether to include physicians in the analysis, whether to compare total cash and total compensation ratios, and other factors. All are avenues for further investigation.
In conclusion, Gallagher's analysis revealed a less extreme picture of the gap between CEO and typical worker pay at NFP hospitals and health systems. However, hospital and health system leaders still must be mindful of what their CEO and other executives are paid relative to their frontline workers and ensure that all workers receive competitive and appropriate pay compared to the market.
Criticism of executive pay is ever-present across industries. In the wake of the COVID-19 pandemic, NFP hospitals and health systems are subject to closer examination than ever. Investing time now to determine the CEO-to-typical-worker pay ratio will give these organizations a head start on communicating equitable pay ratios in light of continued media interest.
Contact us to request a compensation assessment for your organization. This detailed, actionable analysis can guide your organization through the implications of your current compensation program, ascertain your market position, and define a compensation and total rewards philosophy.
Let Gallagher demonstrate how data drives decisions to help your organization face the future with confidence.